GEOTECHNICAL ENGINEERING1
CAMBRIDGE
HomeLaboratoryAtterberg limits

Atterberg Limits Testing in Cambridge: Cohesive Soil Classification

Evidence-based design. Reliable delivery.

LEARN MORE

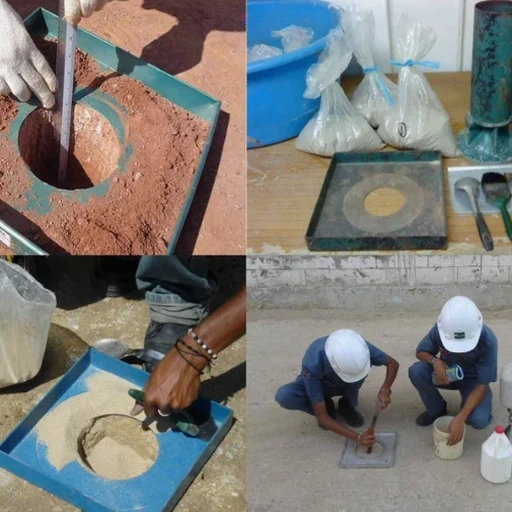
Soil behaviour across Cambridge varies dramatically depending on which side of the River Cam you are working on. The historic colleges and city centre sit predominantly on gravels of the First Terrace, which drain well and offer reasonably predictable bearing. Move east into the newer developments near Barnwell or south towards Trumpington and the clays of the Gault Formation dominate—sometimes stiff, sometimes surprisingly plastic after a wet winter. Without proper classification, assuming a uniform site can lead to serious misinterpretation of settlement potential. Our Atterberg limits testing programme quantifies the liquid limit, plastic limit and plasticity index of these cohesive deposits, giving engineers the data needed to predict volume change. When we encounter silty clay layers near the Backs, we often combine the analysis with a grain size distribution to distinguish true Gault from more recent alluvial silts that behave very differently under load. Cambridge’s building boom around the biomedical campus has pushed foundations onto marginal ground where this distinction matters more than ever.

A plasticity index above 25% in Cambridge’s Gault Clay signals active volume change potential—something no foundation design should ignore.

Our service areas

How we work

What we see repeatedly across Cambridge sites is that soil plasticity does not always correlate with depth in a linear way. A stiff brown clay at two metres can suddenly transition into a softer, higher-plasticity grey clay at three and a half metres—a profile typical of weathered Gault resting on its unweathered parent. This is where the standard penetration test alone falls short. The Atterberg limits test reveals that the lower material may have a plasticity index exceeding 30%, making it highly susceptible to moisture-related volume change. For developments on the clay slopes north of Castle Hill, we recommend pairing the classification with a slope stability assessment, because even minor saturation changes can trigger shallow slips in high-plasticity material. Our technicians run the Casagrande cup method and thread-rolling procedure following BS 5930:2015, ensuring every sample is prepared from material passing the 425-micron sieve. The entire process takes place in our climate-controlled laboratory, where humidity is monitored to avoid the drying-induced shifts that can skew liquid limit results by several percent. Cambridge’s variable groundwater—rising sharply in winter through the chalk aquifer below the city—means we also record the natural moisture content alongside every Atterberg determination, giving a direct indication of how close the soil currently sits to its plastic limit.
Atterberg Limits Testing in Cambridge: Cohesive Soil Classification
Technical reference — Cambridge

Local considerations

The Casagrande cup apparatus on our bench has a simple mechanical principle—a brass cup dropped ten millimetres onto a hard rubber base at two rotations per second—but the decisions it drives are anything but simple. When a Cambridge project pushes ahead without Atterberg data on its cohesive layers, the contractor is effectively guessing at shrink-swell behaviour. We have seen trench backfill near Fen Causeway fail within months because imported clay with a liquid limit above 60% was placed without lime stabilisation; winter saturation turned it into near-slurry. On the other end of the risk spectrum, overly conservative assumptions about plasticity can force a design into deep piles when a well-compacted granular raft would have sufficed. The Atterberg test bridges this gap, providing the numerical classification that Eurocode 7 requires for assigning undrained shear strength parameters in fine soils. For the low-rise residential schemes spreading into Cherry Hinton, classifying the local chalk marl correctly—often a borderline silt with low plasticity—can mean the difference between strip footings and a much more expensive engineered fill solution.

Need a geotechnical assessment?

Reply within 24h.

Email: contact@geotechnical-engineering1.com

Regulatory framework

BS 5930:2015 – Code of practice for ground investigations, BS EN 1997-2:2007 (Eurocode 7) – Ground investigation and testing, BS 1377-2:1990 – Classification tests

Typical values

ParameterTypical value
Liquid limit test methodCasagrande cup (BS 5930:2015)
Plastic limit determinationThread-rolling method
Sieve fraction for testingMaterial passing 425 µm
Plasticity index (PI)LL minus PL
Liquidity indexCalculated from natural moisture content
Sample preparationWet preparation, air-drying below 60°C
Typical Cambridge PI range8% (sandy silts) to 45% (weathered Gault)

Questions and answers

How much does Atterberg limits testing cost for a Cambridge project?

For a single sample tested for liquid limit, plastic limit and natural moisture content, the fee typically falls between £50 and £70. Larger project rates depend on the number of samples and whether you require additional parameters such as linear shrinkage or particle size distribution.

Which soils in Cambridge most need Atterberg classification?

The Gault Clay beneath eastern and southern Cambridge is the primary candidate, particularly where weathered. River terrace silts near the Cam, chalk marl in Cherry Hinton and the Ampthill Clay found deeper in the north of the city also benefit from classification because their plasticity can vary enough to change the foundation strategy.

What is the testing turnaround time for Atterberg limits?

Standard turnaround is three to five working days from sample delivery, assuming the material does not require extended air-drying. For time-sensitive projects on the biomedical campus or university estates, we can process within 48 hours with prior arrangement.

Location and service area

We serve projects in Cambridge and surrounding areas.

View larger map